

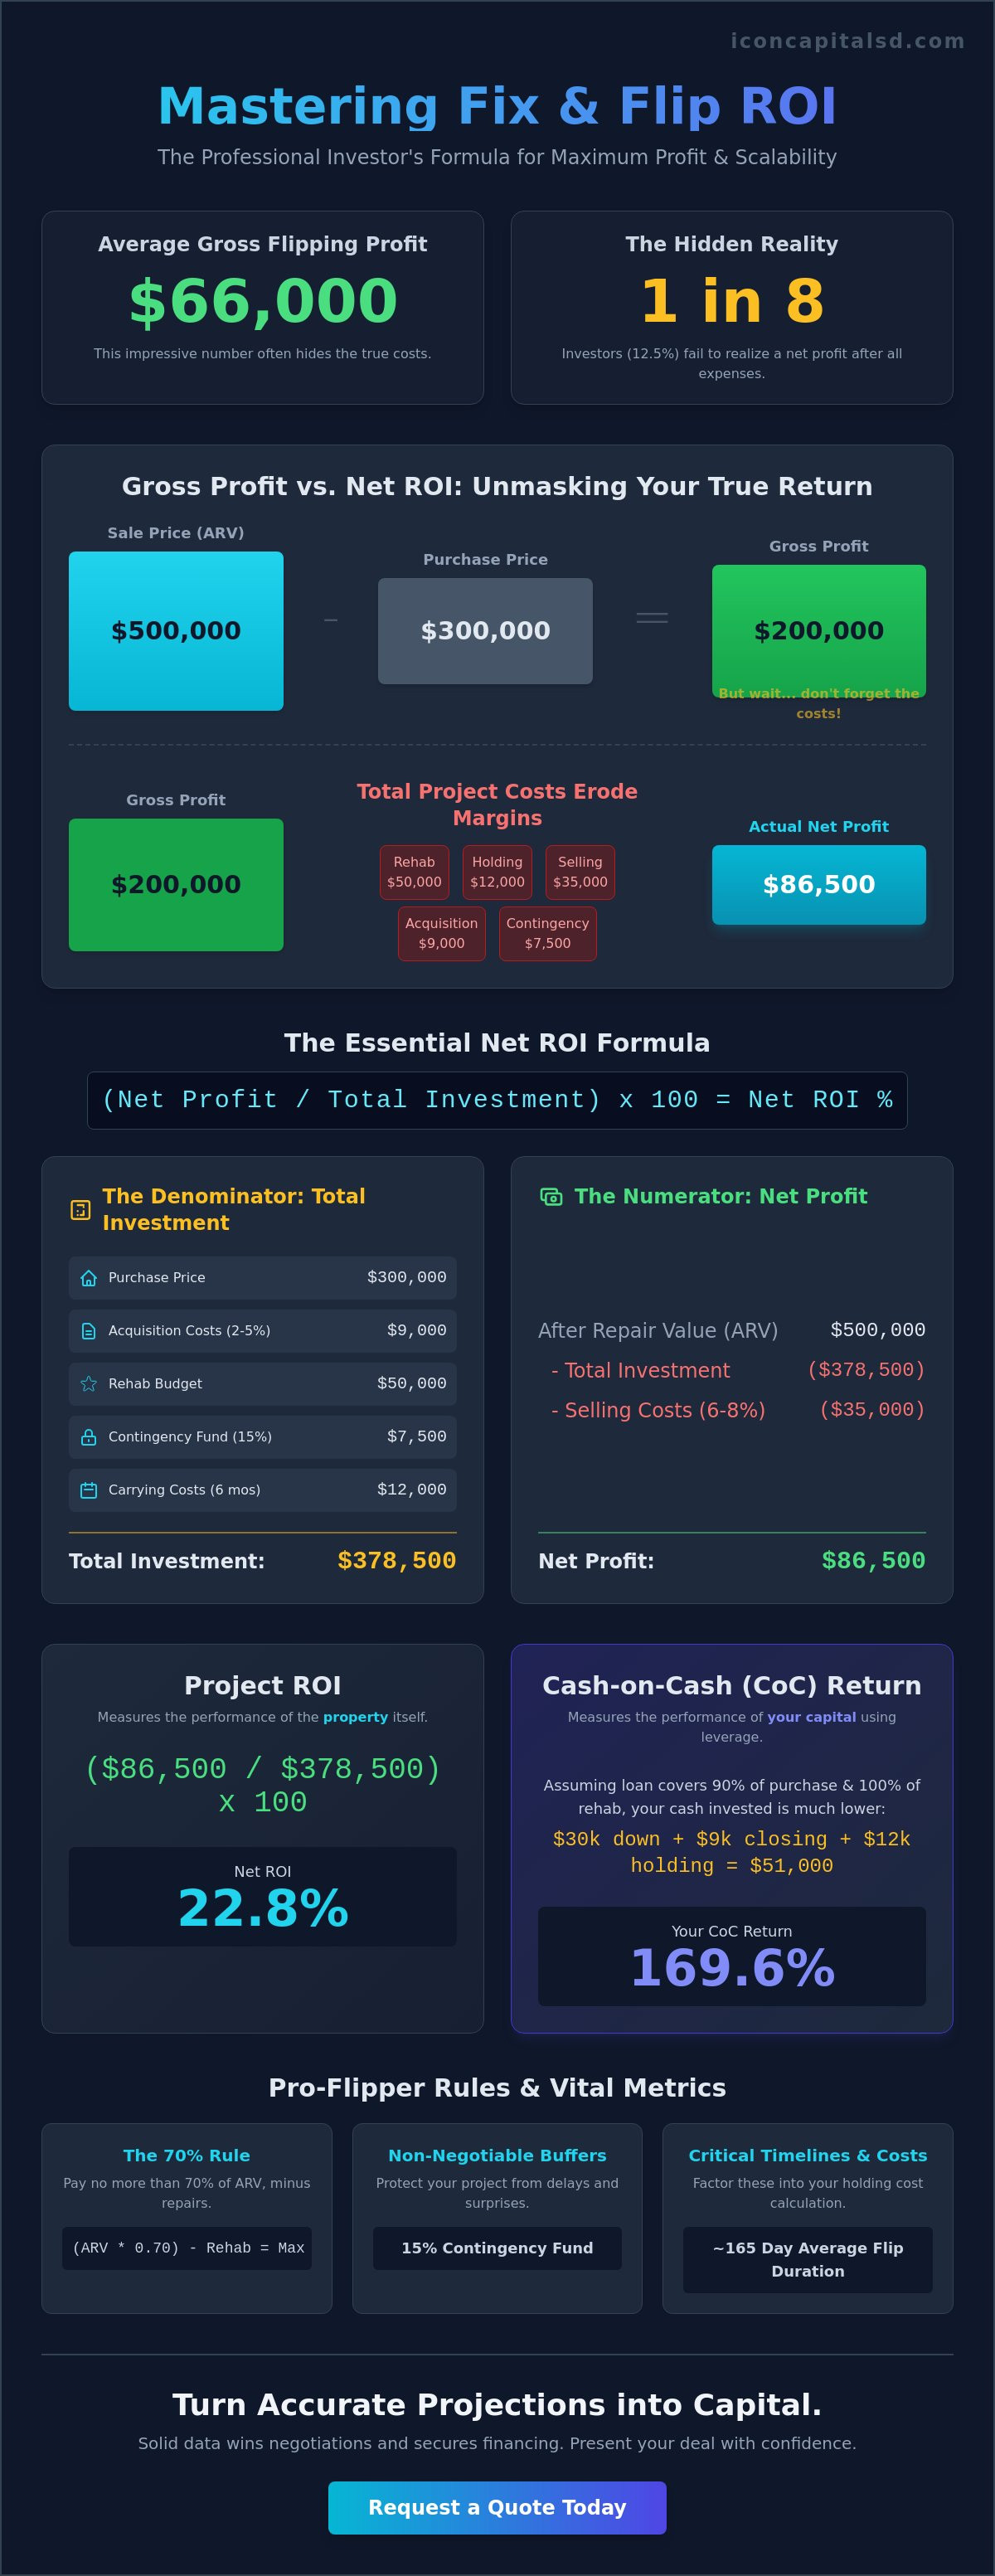
Recent data from ATTOM indicates that while average gross flipping profits reached $66,000 in early 2024, approximately 12.5% of investors failed to realize a net profit after accounting for all expenses. Most professionals understand the basic spread, but accurately calculating roi on a fix and flip requires a deeper dive into the friction costs that often go unnoticed during the initial walkthrough. It’s common to feel confident in a property’s potential only to find that underestimated rehab budgets and holding costs have eroded your margins.
This guide ensures you don’t fall into those common traps. You’ll master the precise formulas and hidden variables required to accurately project profitability and secure financing for your next property flip. We’ll break down a repeatable formula for professional deal analysis and show you exactly how to present these metrics to lenders to maximize your leverage. By the end of this guide, you’ll understand how to turn complex data into a compelling case for capital that helps you scale your portfolio effectively.
Key Takeaways
- Differentiate between gross profit and net ROI to establish a realistic baseline for project profitability and performance.
- Master the technical formulas for calculating roi on a fix and flip, including all soft costs and daily holding expenses that erode margins.
- Analyze the difference between cumulative and annualized ROI to determine the most efficient use of your investment capital over time.
- Utilize high-leverage financing tools like LTC and LTV to increase your personal cash-on-cash return and scale your property portfolio.
Defining ROI in the 2026 Fix and Flip Market
In the 2026 real estate market, success depends on moving past surface-level numbers. Investors often confuse gross profit with actual return. Gross profit is a simple calculation: sales price minus purchase price. This figure ignores the reality of carrying costs, debt service, and selling fees. For a professional investor, Return on investment (ROI) represents the net profit divided by the total cost of the project. It provides a percentage-based view of efficiency that allows you to compare a single-family flip in a suburban market against a multi-unit project in an urban core. Professional success starts with calculating roi on a fix and flip before you ever sign a contract.
Precision is mandatory now. Market data from late 2025 shows that average flip durations have stretched to 165 days. Every extra week of holding time erodes your margins. When you’re calculating roi on a fix and flip, you must account for every dollar spent on insurance, utilities, and interest. Lenders like Icon Capital prioritize ROI because it demonstrates deal viability. High ROI indicates a buffer against market shifts or unexpected repair costs. If your projected ROI is thin, the deal lacks the necessary safety margin to secure competitive financing terms.
The Difference Between ROI and Cash-on-Cash Return
ROI measures the performance of the property itself, but Cash-on-Cash (CoC) return measures the performance of your capital. CoC is the annual pre-tax cash flow divided by the total cash invested. This metric is vital for investors utilizing Fix & Flip loans. Leverage allows you to control a $500,000 asset with $50,000 of your own cash. While the total project ROI might be 12%, your CoC return could exceed 40% because you’ve used less of your own liquidity. This “juicing” of returns is how professional flippers scale their portfolios quickly.
Why ROI is Your Most Powerful Negotiation Tool
Solid data wins negotiations. When you present an offer to a seller, use your ROI projections to justify a lower price point. Show them the math. If the After Repair Value (ARV) is $400,000 and repairs cost $80,000, a $250,000 offer isn’t an insult; it’s a mathematical necessity to hit a 15% net return. This logic also applies to the 70% Rule, where you pay no more than 70% of the ARV minus repair costs. Using ROI data helps you secure private partners or better LTV ratios from lenders. If you can prove a deal has a 25% ROI floor, you’re in a position of strength. To see how your current numbers stack up for financing, request a quote today.
The Essential ROI Formulas for Property Investors
Net ROI is the final percentage of profit realized on a real estate project after deducting all acquisition, renovation, carrying, and selling costs.
To master calculating roi on a fix and flip, you must move beyond gross margins. The standard formula is (Net Profit / Total Investment) x 100. This calculation provides the percentage of return relative to the capital deployed. While gross ROI looks at top-line numbers, Net ROI accounts for the friction of transaction costs and taxes. Successful investors use this metric to compare potential flips against other asset classes like DSCR rentals or equity markets.
Calculating Total Investment (The Denominator)
The denominator represents every dollar committed to the project. It starts with the purchase price but extends far into the lifecycle of the flip. You must include acquisition closing costs, which typically range from 2% to 5% of the purchase price. Carrying reserves are equally critical. These cover property taxes, insurance, and interest payments during the renovation period.
- Purchase Price: $300,000
- Acquisition Costs: $9,000
- Rehab Budget: $50,000
- Contingency Fund (15%): $7,500
- Carrying Costs (6 months): $12,000
- Total Investment: $378,500
A 15% contingency fund is a non-negotiable buffer. Construction delays or hidden structural issues frequently inflate budgets. If you don’t account for these variables, your actual ROI will lag behind your pro forma projections. Investors looking to maximize their leverage often request a quote to see how debt service affects their total capital requirement.
Determining Net Profit (The Numerator)
Net profit is the actual cash remaining after the final sale. You begin with the After Repair Value (ARV). From this number, subtract the total investment calculated above. Next, remove selling costs. These usually total 6% to 8% of the sale price, covering agent commissions, staging, and title fees. A $500,000 sale price might incur $35,000 in transaction friction.
Tax liabilities represent the final hurdle in calculating roi on a fix and flip. Because most flips conclude in under 12 months, profits are taxed as short-term capital gains. These rates align with your ordinary income tax bracket, which can reach 37% for high earners. Ignoring this obligation leads to a significant overestimation of your take-home pay. Always calculate your profit after-tax to understand the true performance of your capital.
Beyond the Purchase Price: Factoring in All Rehab and Holding Costs
The most frequent error investors make isn’t overestimating the sale price. It’s ignoring the soft costs that accumulate throughout the project. Precision in calculating roi on a fix and flip requires looking at the calendar as much as the contractor’s bid. Every day a property remains in your inventory, your profit margin shrinks. You aren’t just paying for lumber and labor; you’re paying for the right to own that asset while it’s under construction.
In 2026, market volatility makes these carrying costs even more volatile. National insurance premiums for investment properties are projected to rise by 12% in specific high-risk regions. Utility rates also continue to climb as grids modernize, adding 4% to 6% to annual operating expenses. If you don’t account for these shifts, your projected 20% return can easily drop into single digits before you ever list the property.
The Reality of Holding Costs
Holding costs are the silent killers of a deal. They include recurring expenses that don’t add value to the home but are necessary to maintain it. You must track property taxes, builder’s risk insurance, water, electricity, and HOA fees. To understand your risk, calculate your daily “burn rate.” Total your monthly carrying costs and divide by 30. If your burn rate is $145 per day, a 60-day permit delay costs you $8,700 in pure profit.
- Property Taxes: These accrue daily based on the local millage rate.
- Insurance: Specialized vacant home or renovation policies are more expensive than standard homeowner insurance.
- Utilities: High-usage periods during HVAC testing or power tool operation spike these bills.
- HOA Dues: These are non-negotiable and often include hefty transfer fees.
A common mistake is planning for a perfect 6-month timeline. Industry data from 2025 shows that 74% of flips experience delays due to labor shortages or municipal inspections. Smart investors buffer for a 9-month timeline when calculating roi on a fix and flip to ensure the deal remains viable even with setbacks.
Financing Costs and Loan Points
Leverage is essential for scaling, but it comes with specific friction costs. When flipping houses with hard money, you’ll encounter origination points, which are upfront fees calculated as a percentage of the loan. These typically range from 1% to 3%. You also need to budget for draw inspection fees. Every time you request a fund release for completed work, an inspector charges $200 to $350 to verify the progress.
Most fix and flip loans utilize interest-only payments. This structure helps cash flow because you aren’t paying down principal during the rehab phase. However, it means your monthly payment doesn’t decrease over time. If your project stalls, those interest payments continue to compound. To get an accurate baseline for your financing math, consider requesting a quote early. Knowing your exact points and interest rate allows you to build a realistic exit strategy without guessing at the cost of capital.
Cumulative vs. Annualized ROI: Which Metric Matters Most?
Cumulative ROI measures the total profit relative to the total capital invested over the entire project lifespan. It provides a simple snapshot of gross performance. Annualized ROI, however, adjusts that return to a standard 12-month timeframe. This distinction is critical when calculating roi on a fix and flip because it accounts for the hidden cost of time.
A 20% cumulative return on a 4-month flip is mathematically superior to a 25% return on a 10-month project. While the 10-month project yields more total dollars, the 4-month flip allows an investor to recycle capital three times in a single year. Professional investors use annualized figures to benchmark real estate against other asset classes like equities or private debt, ensuring their capital isn’t trapped in low-velocity deals.
The Time-Value of Capital in House Flipping
The formula for Annualized ROI is: [(1 + Cumulative ROI)^(365 / days held)] – 1. This metric highlights the “Velocity of Money,” a concept where the speed of capital deployment dictates the growth of a portfolio. Consider two scenarios:
- Scenario A: A cosmetic flip with a 15% cumulative ROI held for 90 days. The annualized return is 74.9%.
- Scenario B: A major structural rehab with a 30% cumulative ROI held for 300 days. The annualized return is 37.8%.
Scenario A generates significantly higher velocity, allowing you to scale a portfolio faster by leveraging capital more frequently. High-velocity investors prioritize throughput over total margin per unit. To maintain this momentum, you can request a quote for financing that matches your project speed.
When Cumulative ROI is Misleading
High cumulative returns often mask poor operational efficiency. Project creep, which involves unexpected delays in permitting or contractor scheduling, destroys annualized returns even if the final profit remains high. If a project planned for 180 days stretches to 360 days, your annualized ROI is effectively cut in half, doubling your opportunity cost.
Experienced flippers set “exit triggers” to protect their capital. If a property hasn’t sold by day 120, a 5% price reduction might be necessary to preserve the annualized target rather than holding for a higher price that won’t materialize for another 90 days. Market seasonality also impacts hold times. Properties listed in late Q4 often sit 40% longer than those listed in Q2, directly eroding the efficiency of your investment. When calculating roi on a fix and flip, always weigh the total profit against the calendar to ensure your capital is working at its highest capacity.
Leveraging Fix and Flip Loans to Maximize Your Cash-on-Cash Return
Using leverage is the most effective way to scale a real estate portfolio. When you use 80% to 90% financing, you reduce the amount of personal capital tied up in a single property. This shift moves the focus from total project profit to your cash-on-cash return. While 100% cash deals eliminate interest costs, they also limit your ability to diversify. Most professional flippers prioritize Loan to Cost (LTC) because it covers both the purchase price and the renovation budget. By contrast, Loan to Value (LTV) focuses on the final After Repair Value (ARV). Understanding these ratios is vital when calculating roi on a fix and flip because they dictate your initial liquidity requirements.
The Math of Leverage: Cash vs. Loan
A $400,000 acquisition with a $100,000 rehab budget requires $500,000 in total capital. If you fund this with 100% cash and sell for $650,000, your ROI is 30% before closing costs. However, by using a fix and flip loan at 90% LTC, your out-of-pocket investment drops to $50,000. Even after accounting for 10% interest and points, your cash-on-cash return can exceed 150%. This strategy allows an investor to deploy that same $500,000 across three or four concurrent projects instead of one. In a cooling 2026 market, over-leverage is a risk if property values stagnate. Investors must maintain a cash reserve to handle 10% to 15% longer hold times than the 2024 averages. This buffer ensures you don’t face a liquidity crunch if the sale takes nine months instead of six.
Structuring Your Deal for Approval
Lenders don’t just look at the property; they look at the math. When calculating roi on a fix and flip for an underwriter, your pro forma must demonstrate a clear exit strategy. Icon Capital evaluates deals based on ARV accuracy and the feasibility of the renovation timeline. High-yield projects often require creative financing structures that traditional banks won’t touch. Underwriters prioritize the Debt Service Coverage Ratio (DSCR) for long-term holds, but for flips, the focus is on the net profit margin after all debt service. To secure the best rates, present a detailed line-item budget and a track record of similar exits. We focus on the mechanics of the deal to ensure your capital works as hard as possible. Ready to scale your operations? Request a Quote to see how our financing structures can boost your next project’s ROI.
Secure Your Margins in a Competitive Market
Success in the 2026 market isn’t about guessing. You’ve got to account for every line item from holding costs to annualized performance metrics. Mastering the process of calculating roi on a fix and flip ensures you remain profitable in a shifting market where precision is the only path to scale. Data from 2025 industry reports highlights that inventory remains tight, making efficient capital use a top priority for active flippers. Icon Capital provides the specialized infrastructure needed to protect these margins. We offer Fix and Flip programs with up to 90% LTC and provide fast funding to help you close competitive deals. Our expertise in Non-QM and creative financing allows us to structure loans that traditional banks often overlook. By leveraging these tools, you can preserve your liquid capital and increase your cash-on-cash returns across multiple properties.
Get a custom Fix & Flip loan quote to maximize your project ROI
Your next successful exit starts with the right numbers and a partner who understands the mechanics of the deal.
Frequently Asked Questions
What is a “good” ROI for a fix and flip in 2026?
A healthy net ROI for a fix and flip typically ranges between 15% and 30% after all expenses are paid. According to ATTOM Data Solutions, the average gross flipping profit reached 27.5% in recent years. In 2026, investors should target a minimum 20% return to provide a sufficient buffer against market volatility and rising material costs. Deals yielding under 10% often lack the margin to survive unexpected renovation delays.
How does the 70% rule relate to calculating ROI?
The 70% rule is a foundational formula used when calculating roi on a fix and flip to determine your maximum allowable offer. It dictates that an investor should pay no more than 70% of the After Repair Value minus the estimated repair costs. This 30% margin is designed to cover financing, closing costs, and your desired profit. If you exceed this threshold, your net ROI will likely drop below 15%.
Should I include my own labor costs when calculating ROI?
You must include the market value of your labor to accurately assess the project’s actual profitability. If you spend 200 hours on a renovation, failing to account for a $50 per hour labor rate inflates your perceived return. Professional investors treat their time as a line item expense. This ensures the deal is profitable on its own merits without relying on sweat equity to hide poor margins.
How do financing points and interest affect my final return?
Financing costs directly reduce your net profit and can lower your total ROI by 3% to 7% depending on the loan term. Most hard money lenders charge 1 to 3 points upfront plus interest rates between 10% and 13%. On a $300,000 loan, 2 points and a six month hold at 12% interest add $24,000 in costs. These capital expenses must be subtracted from the gross profit before you finalize your ROI.
What is the difference between ROI and ROE in real estate?
ROI measures the return on the total investment amount, while ROE measures the return on the specific equity you have in the property. ROI provides a snapshot of the deal’s overall performance regardless of leverage. ROE is a dynamic metric that changes as you pay down debt or as the property appreciates. For a fix and flip, ROI is the primary metric for evaluating the initial acquisition and exit strategy.
Can I use a DSCR loan for a fix and flip project?
DSCR loans are generally not suitable for fix and flip projects because they require the property to be tenant occupied and cash flowing. These loans focus on the Debt Service Coverage Ratio of a stabilized rental asset. For a flip, you need a bridge loan or hard money product that allows for vacant renovations. Once the property is stabilized with a tenant, you can refinance into a DSCR loan.
What happens to my ROI if the property doesn’t sell at the projected ARV?
A lower sale price results in a linear reduction of your ROI and can potentially lead to a net capital loss. If your ARV drops by 10% on a $500,000 property, you lose $50,000 in profit immediately. This scenario often occurs when market days on market exceed 60 days. Investors use a 5% to 10% contingency buffer in their initial calculations to mitigate this specific market risk.
How do I calculate ROI if I decide to “Fix and Rent” instead of sell?
You shift from calculating a single exit ROI to calculating annual Cash-on-Cash return and total ROI over a specific hold period. When calculating roi on a fix and flip that turns into a rental, use the formula: (Annual Cash Flow + Equity Gain) divided by Total Cash Invested. If you invested $100,000 and the property generates $12,000 in annual net cash flow, your Cash-on-Cash return is 12%.